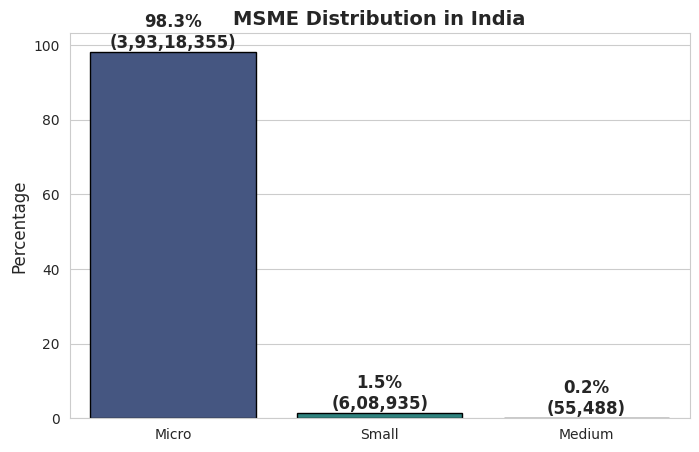
micro=3_93_18_355small=6_08_935medium=55_488all=micro+small+mediumprint("Total active MSMEs: ",all)print("micro %: ",(micro*1.0)/all)print("small %: ",(small*1.0)/all)print("medium %: ",(medium*1.0)/all)# Import required librariesimportseabornassnsimportmatplotlib.pyplotaspltimportpandasaspd# Ensure plots show inline in Google Colab%matplotlibinline# Datacategories=["Micro","Small","Medium"]percentages=[98.3,1.5,0.2]counts=["3,93,18,355","6,08,935","55,488"]# Create a DataFramedf=pd.DataFrame({"Category":categories,"Percentage":percentages,"Count":counts})# Set Seaborn stylesns.set_style("whitegrid")# Create the bar plotplt.figure(figsize=(8,5))ax=sns.barplot(x="Category",y="Percentage",data=df,palette="viridis",edgecolor="black")# Annotate with exact percentages and countsfori,(percent,count)inenumerate(zip(df["Percentage"],df["Count"])):ax.text(i,percent+1,f"{percent}%\n({count})",ha="center",fontsize=12,fontweight="bold")# Labels and titleplt.xlabel("")plt.ylabel("Percentage",fontsize=12)plt.title("MSME Distribution in India",fontsize=14,fontweight="bold")# Show plot inline in Colabplt.show()
The result is very clear: the vast majority of MSMEs are micro businesses.
Classifying MSMEs
Criteria
Turnover
Investment
Micro
Rs. 5 crores (US$ 610,000)
Less than Rs. 1 crore (US$ 120,000)
Small
Rs. 50 crores (US$ 6.1 million)
More than Rs. 1 crore (US$ 120,000) but less than Rs. 10 crore (US$ 1.2 million)
Medium
Rs. 250 crores (US$ 30.4 million)
More than Rs. 10 crore (US$ 1.2 million), but less than Rs. 50 crore (US$ 6.1 million)
For our question, we are interested in only Small and Medium MSMEs.
The reason is simple: we are looking for companies that are already generating 1M+ USD in ARR.
Micro businesses do not fall in this category.
Estimating the Number of MSMEs with > 8.3 Cr INR in ARR
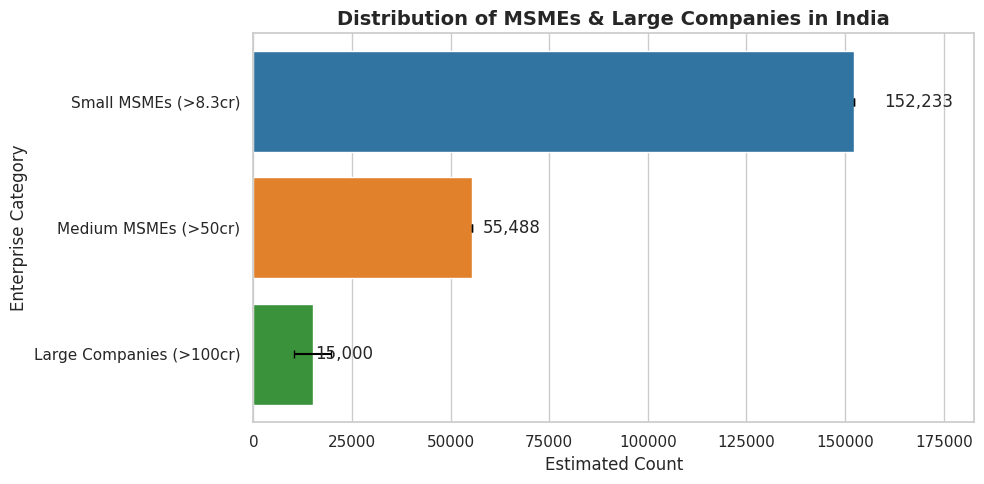
Small MSMEs
50% above Rs. 5 crore → 304,467
50% of those above Rs. 8.3 crore → 152,234
Medium MSMEs
55,488 (all above Rs. 50 crore)
Large Companies
Estimated between 10,000 to 20,000
Monte Carlo Simulation
Uses random sampling to estimate a 95% confidence interval for large companies.
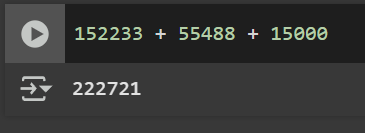
Final Estimate
Total Range: ~ 100,000 to 200,000
95% CI for Large Companies: A refined estimate with confidence bounds.
This provides a quantitative estimate while acknowledging uncertainty.
# Calculate the number of MSMEs in each categoryimportnumpyasnpimportscipy.statsasstats# Given datasmall_total=608935small_above_5cr=small_total*0.5# 50% above Rs. 5 croresmall_above_8_3cr=small_above_5cr*0.5# 50% above Rs. 8.3 croremedium_total=55488# All medium MSMEs are above Rs. 50 crore# Large companies estimatelarge_lower=10000large_upper=20000# Estimate range of total countestimated_total_lower=small_above_8_3cr+medium_total+large_lowerestimated_total_upper=small_above_8_3cr+medium_total+large_upper# Confidence interval for large companies (assuming uniform distribution)large_sample=np.random.uniform(large_lower,large_upper,10000)# Monte Carlo samplingconfidence_interval=np.percentile(large_sample,[2.5,97.5])# 95% confidence interval# Print resultsprint(f"Estimated Small MSMEs above Rs. 8.3 crore: {int(small_above_8_3cr):,}")print(f"Medium MSMEs: {int(medium_total):,}")print(f"Estimated Large Companies: {int(large_lower):,} to {int(large_upper):,}")print(f"Total Estimate: {int(estimated_total_lower):,} to {int(estimated_total_upper):,}")print(f"95% Confidence Interval for Large Companies: {confidence_interval[0]:,.0f} to {confidence_interval[1]:,.0f}")
importnumpyasnpimportpandasaspdimportseabornassnsimportmatplotlib.pyplotasplt# Seaborn stylingsns.set_theme(style="whitegrid")# Given datacategories=["Small MSMEs (>8.3cr)","Medium MSMEs (>50cr)","Large Companies (>100cr)"]small_total=608935small_above_5cr=small_total*0.5# 50% above Rs. 5 croresmall_above_8_3cr=small_above_5cr*0.5# 50% above Rs. 8.3 croremedium_total=55488# All medium MSMEs are above Rs. 50 crorelarge_lower,large_upper=10000,20000# Large company estimate# Monte Carlo simulation for Large Companies CIlarge_sample=np.random.uniform(large_lower,large_upper,10000)confidence_interval=np.percentile(large_sample,[2.5,97.5])# 95% confidence interval# Dataframe for plottingdata=pd.DataFrame({"Category":categories,"Count":[small_above_8_3cr,medium_total,(large_lower+large_upper)/2],# Use mid-point for Large"Lower":[small_above_8_3cr,medium_total,confidence_interval[0]],"Upper":[small_above_8_3cr,medium_total,confidence_interval[1]]})# Calculate xerr (error bars)data["xerr"]=data["Upper"]-data["Count"]# Only positive error bars# Plotplt.figure(figsize=(10,5))ax=sns.barplot(data=data,y="Category",x="Count",hue="Category",# Assign hue to avoid warningpalette=["#1f77b4","#ff7f0e","#2ca02c"],# Custom colorserrorbar=None,# Disable automatic error barscapsize=0.2)# Manually add error bars for Large Companiesplt.errorbar(x=data["Count"],y=range(len(data)),xerr=data["xerr"],fmt="none",ecolor="black",elinewidth=1.5,capsize=3)# Labels & Titlesplt.xlabel("Estimated Count")plt.ylabel("Enterprise Category")plt.title("Distribution of MSMEs & Large Companies in India",fontsize=14,fontweight="bold")plt.legend([],[],frameon=False)# Remove extra legend# Add exact numbers as textfori,(value,category)inenumerate(zip(data["Count"],data["Category"])):plt.text(value*1.05,i,f"{int(value):,}",va='center',fontsize=12)plt.xlim(0,max(data["Upper"])*1.2)# Scale x-axis properlyplt.tight_layout()# Show plotplt.show()
The Result
The Conclusion
The toal number of MSMEs with 1M+ USD in ARR is somewhere around 200K organizations. That is a mere 0.5% of the 4 crore businesses active in the country.
It could be interesting to compare India’s data to:
Other developing countries of the present day
Recently developed countires of the past 50-75 years